| Random Link ¯\_(ツ)_/¯ | ||||||||||||||||||||
| Oct 10, 2020 | » | Similarity Measures
2 min; updated Sep 5, 2022
To classify something, find things that are similar and label it with the same class as the most similar thing. The feature space is \(N-d\), where \(N\) is the number of features. Each instance is mapped to a point. The descriptive features become the axes. The Similarity MetricMathematically, it must conform to these 4 criteria:
| ||||||||||||||||||
| Oct 10, 2020 | » | The Nearest Neighbor Algorithm
2 min; updated Feb 12, 2023
The Algorithm
Doing this naively is computationally expensive. That’s why there are faster lookup methods, e.g. k-d trees.
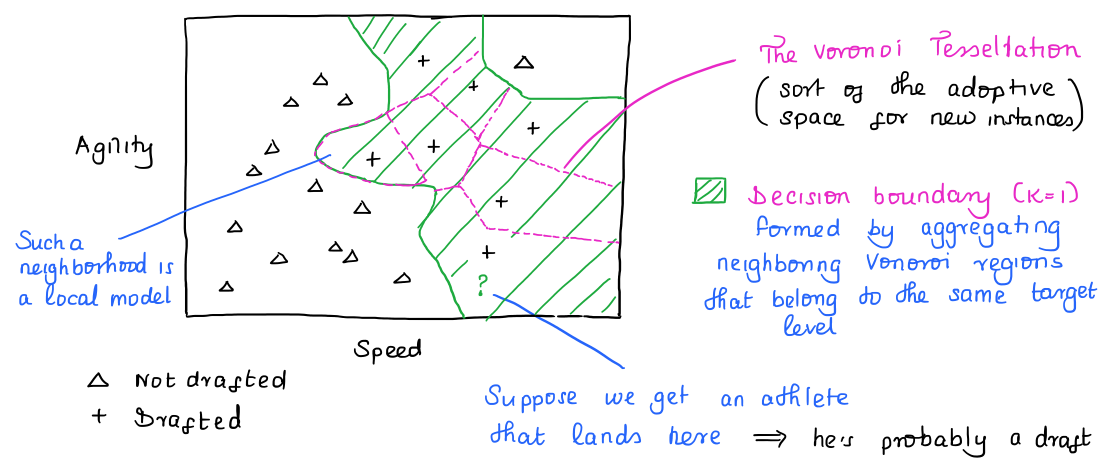 Remarks on the AlgorithmUpdating the model is quite cheap. Adding an instance updates the Voronoi tessellation and therefore the decision boundary. ... | ||||||||||||||||||
| Oct 10, 2017 | » | Caveats on Similarity Learning
1 min; updated Mar 14, 2021
Similarity-based learning is intuitive and gives people confidence in the model. There is an inductive bias that instances that have similar descriptive features belong to the same class. Remarkably so. When I think of classifying things, my mind immediately goes to NN. Similarity learning has a stationary assumption, i.e. the joint PDF of the data doesn’t change (new classifications do not come up). This assumption is shared by supervised ML. Furthermore, an NN model can only give answers that are present in the training set. Ergo, is your training set representative? | ||||||||||||||||||
| Oct 17, 2017 | » | Handling Noisy Data in Nearest Neighbors
1 min; updated Mar 14, 2021
Majority VotingThe \(k\) nearest neighbors model predicts the target level from the majority vote from the set of the \(k\) nearest neighbors to the query \(q\). Where \(\delta\) is an indicator function such that \(\delta(t_i, l) = 1 \iff t_i = l\): $$ \mathbb{M}_{k} (q) = argmax_{l \in levels(t)} \left( \sum_{i=1}^{k} \delta(t_i, l) \right) $$ For categorical features, \(k\) should be odd to avoid ties. This doesn’t read right. If there are 3 possible categories, \(k = 3\) can result in a tie. “\(k \mod |categories| \ne 0 \)” seems like an alternative choice, but \(k = 4\) could result in \(\{2, 2, 0\}\) votes for 3 possible categories. ... | ||||||||||||||||||
| Oct 17, 2017 | » | The Case for Range Normalization
1 min; updated Mar 14, 2021
When you have features taking different range if values, you may have odd predictions. For example, if \(f_1 \in [0, 100]\) and \(f_2 \in [0, 1]\), \(f_1\) will always be penalized more than \(f_2\) when computing the distance. To mitigate this, normalize the feature’s ranges to \([r_{low}, r_{high}]\): $$ a’_i = \frac{a_i - a_{min}}{ a_{max} - a_{min}} \cdot (r_{high} - r_{low}) + r_{low} $$ Typically, the range is normalized to \([r_{low}, r_{high}] = [0, 1]\), so range normalization simplifies to: ... | ||||||||||||||||||
| Oct 17, 2017 | » | Predicting Continuous Targets Using NN
1 min; updated Mar 14, 2021
Return the Average ValueOne possible solution is to return the average value in the neighborhood, i.e. $$ \mathbb{M}_{k}(q) = \frac{1}{k} \sum_{i=1}^{k} t_i $$ We can improve this by using weighted \(k-NN\): $$ \mathbb{M}_{k}(q) = \frac{ \sum_{i=1}^{k} \left( \frac{1}{dist(q, d_i)^2} \cdot t_i \right) }{ \sum_{i=1}^{k} \frac{1}{dist(q, d_i)^2} } $$ The formula looks new. However, if \(x_1\) is weighted by \(w_1\) and \(x_2\) by \(w_2\), then the weighted average is: $$ \frac{w_1 x_1 + w_2 x_2 }{w_1 + w_2} $$ ... | ||||||||||||||||||
| Oct 17, 2017 | » | Other Measures of Similarity in NN
2 min; updated Feb 12, 2023
Note: similarity indexes may not specify the 4 NIST specifications of a similarity metric . Consider these two instances:
\(CP(q, d)\), the number of the co-presences of binary features, is \(2\) because of \(f_3\) and \(f_4\). \(CA(q, d)\), the number of co-absences, is \(1\) because of \(f_1\). Russel-RaoWhere \(|q|\) is the total number of binary features considered: ... | ||||||||||||||||||
| Aug 9, 2018 | » | The Curse of Dimensionality and Feature Selection
3 min; updated Mar 14, 2021
The Curse of DimensionalityThe predictive power of an induced model is based either on:
Therefore, the sampling density (the average density of training instances across the feature space) is an important factor. ... |
Why are non-negativity and triangular inequality important? It seems that we should think of the similarity metric as a measure of “distance”. Distance between two instances obeys the non-negativity & triangular inequality conditions.
...