Aggregation functions allow you to group and combine data from multiple rows into a summary value.
Use the summarize operator
Find the number of events by state.
| State | TotalStorms |
|---|---|
| TEXAS | 4,701 |
| KANSAS | 3,166 |
| … | … |
StormEvents
| summarize TotalStorms = count() by State
summarize groups together rows based on the by clause and uses the
aggregation function to combine each group into a single row.
Visualize query results
Show a bar chart for the number of storm events by state for the top 5 states.
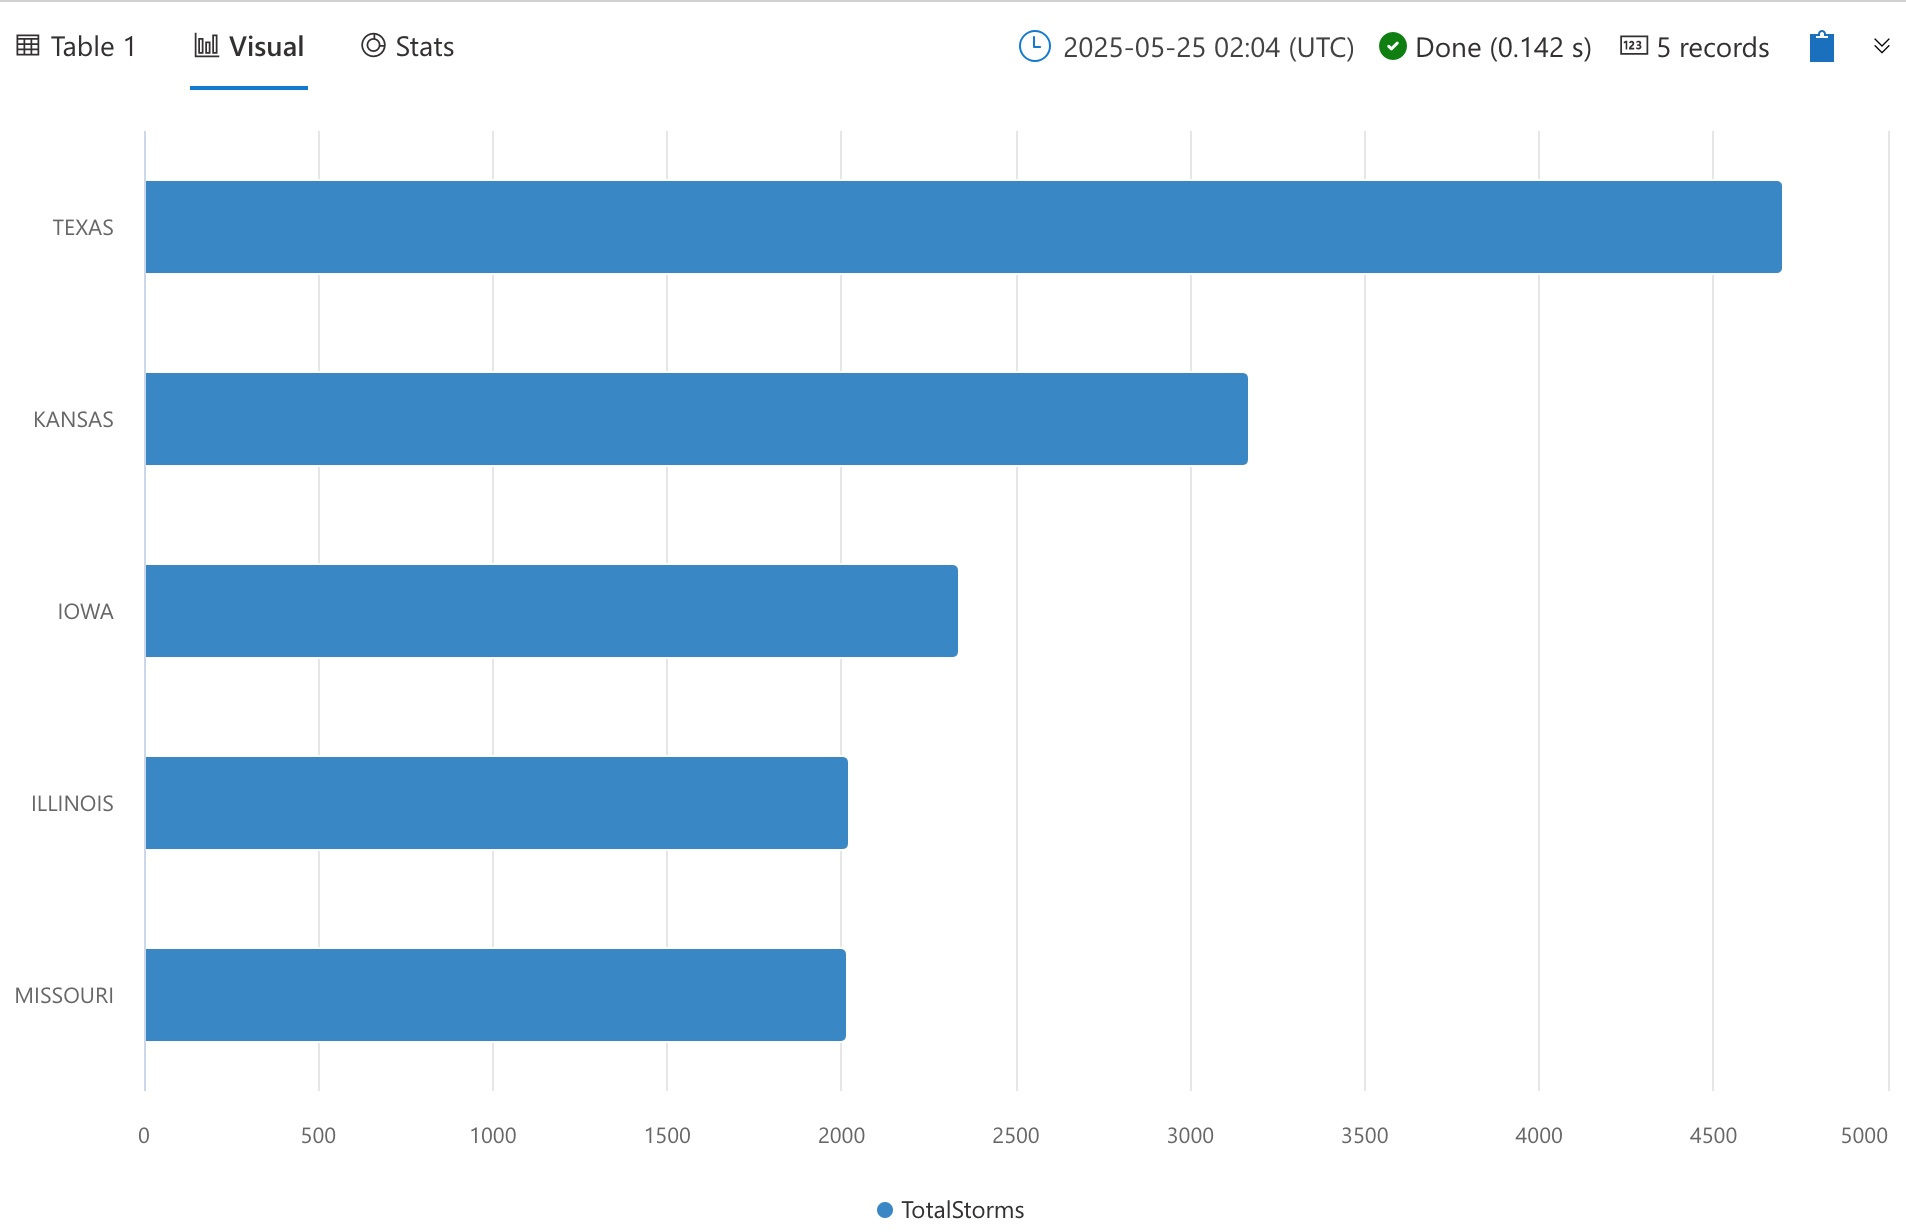
Top 5 states with highest number of storm events.
StormEvents
| summarize TotalStorms = count() by State
| top 5 by TotalStorms
| render barchart
Conditionally count rows
Query the top 2 states with the greatest number of storms that caused crop damage.
| State | StormsWithCropDamage |
|---|---|
| IOWA | 359 |
| NEBRASKA | 201 |
StormEvents
| summarize StormsWithCropDamage = countif(DamageCrops > 0) by State
| top 2 by StormsWithCropDamage
Group data into bins
Query the number of storms that caused crop damage for each week in 2007.
| StartTime | EventCount |
|---|---|
| 2007-01-01T00:00:00Z | 16 |
| 2007-01-08T00:00:00Z | 20 |
StormEvents
| where StartTime between (datetime(2007-01-01) .. datetime(2007-12-31)) and DamageCrops > 0
| summarize EventCount = count() by bin(StartTime, 7d)
Makes sense that one should first use where to ensure that the input table for
the bin function only contains the rows of interest. It would be
over-engineering on bins part to also exclude some rows.
bin reduces every value to the nearest multiple of the modulus that you supply
and allows summarize to assign the rows to groups.
Calculate the min, max, avg, and sum
Of the events that caused crop damage, calculate the minimum, maximum, and average crop damage for each event type and then sort the result by the average damage.
| EventType | MaxCropDamage | MinCropDamage | AvgCropDamage |
|---|---|---|---|
| Frost/Freeze | 568,600,000 | 3,000 | 9,106,087.5954198465 |
| Wildfire | 21,000,000 | 1,000 | 7268333.333333333 |
| … | … | … | … |
StormEvents
| where DamageCrops > 0
| summarize
    MaxCropDamage = max(DamageCrops),
    MinCropDamage = min(DamageCrops),
    AvgCropDamage = avg(DamageCrops)
    by EventType
| sort by AvgCropDamage desc
*if equivalents of min, max, avg, and sum, also exist, e.g.,
StormEvents
| summarize
    MaxCropDamage = maxif(DamageCrops, DamageCrops > 0),
    MinCropDamage = minif(DamageCrops, DamageCrops > 0),
    AvgCropDamage = avgif(DamageCrops, DamageCrops > 0)
    by EventType
| sort by AvgCropDamage desc
Plot the total number of damaged crops for each week in 2007.
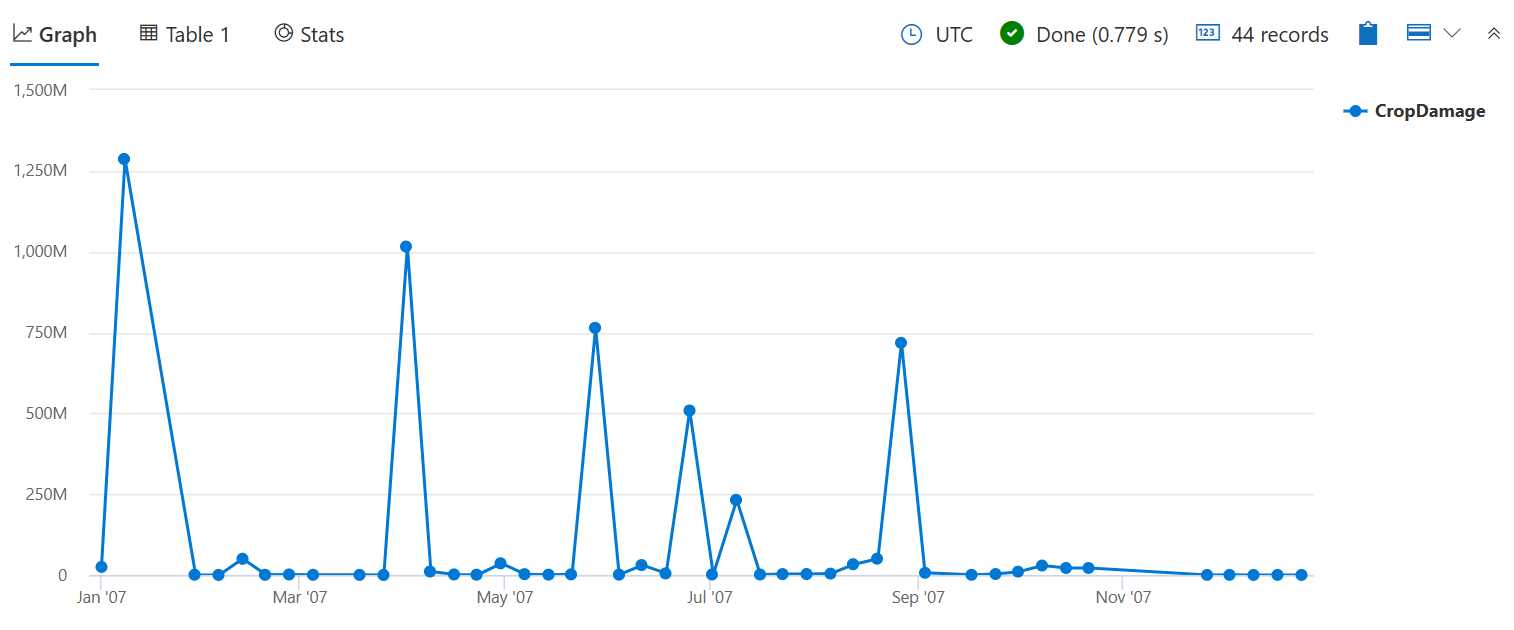
Sum crop damage by week.
StormEvents
| where StartTime between (datetime(2007-01-01) .. datetime(2007-12-31)) and DamageCrops > 0
| summarize CropDamage = sum(DamageCrops) by bin(StartTime, 7d)
| render timechart
Calculate percentages
Find the percentage (round to 2 d.p.) of storm events that caused crop damage in each state. Sort by the number of storms that caused crop damage.
| State | TotalStormsInState | StormsWithCropDamage | PercentWithCropDamage |
|---|---|---|---|
| IOWA | 2,337 | 359 | 15.36 |
| NEBRASKA | 1,766 | 201 | 11.38 |
| … | … | … | … |
StormEvents
| summarize
	TotalStormsInState = count(),
	StormsWithCropDamage = countif(DamageCrops > 0)
	by State
| extend PercentWithCropDamage = round(todouble(StormsWithCropDamage) / TotalStormsInState * 100, 2)
| sort by StormsWithCropDamage
To avoid truncated results due to integer division, convert either the dividend
or the divisor using todouble() or toreal().
Compare the number of storms by event type to the total number of storms in the database. Sort by the percentage.
| EventType | EventCount | Percentage |
|---|---|---|
| Thunderstorm Wind | 13,015 | 22.034673077574237 |
| Hail | 12,711 | 21.519994582331627 |
| … | … | … |
let TotalStormEvents = toscalar(StormEvents | count);
StormEvents
| summarize EventCount = count() by EventType
| extend Percentage = toreal(EventCount) / TotalStormEvents * 100
| sort by Percentage
toscalar is needed because StormEvents | count is a tabular expression that
returns a \(1 \times 1\) table.
StormEvents | count is equivalent to StormEvents | summarize count().
Extract unique values
For each state, return an array of storm types that have caused deaths. Sort by the number of storm types.
| State | StormTypesWithDeaths |
|---|---|
| CALIFORNIA | [“Thunderstorm Wind”, “High Surf”, “Cold/Wind Chill”, “Strong Wind”, “Rip Current”, “Heat”, “Excessive Heat”, “Wildfire”, “Dust Storm”, “Astronomical Low Tide”, “Dense Fog”, “Winter Weather”] |
| TEXAS | [“Flash Flood”, “Thunderstorm Wind”, “Tornado”, “Lightning”, “Flood”, “Ice Storm”, “Winter Weather”, “Rip Current”, “Excessive Heat”, “Dense Fog”, “Hurricane (Typhoon)”, “Cold/Wind Chill”] |
| … | … |
StormEvents
| where DeathsDirect > 0 or DeathsIndirect > 0
| summarize StormTypesWithDeaths = make_set(EventType) by State
| sort by array_length(StormTypesWithDeaths)
summarize StormTypesWithDeaths = make_set(EventType) by State somehow does
project State, StormTypesWithDeaths for me. What’s the name of this
phenomenon?
Bucket data by condition
Group the states based on the number of storm-related injuries sustained by their residents. Sort alphabetically by state name.
| State | InjuriesCount | InjuriesBucket |
|---|---|---|
| ALABAMA | 494 | Large |
| ALASKA | 0 | No injuries |
StormEvents
| summarize InjuriesCount = sum(InjuriesDirect) by State
| extend InjuriesBucket = case(
    InjuriesCount > 50, 'Large',
    InjuriesCount > 10, 'Medium',
    InjuriesCount > 0, 'Small',
    'No injuries')
| sort by State asc
Create a pie chart to visualize the proportion of states that experienced storms resulting in a large, medium, or small number of injuries.
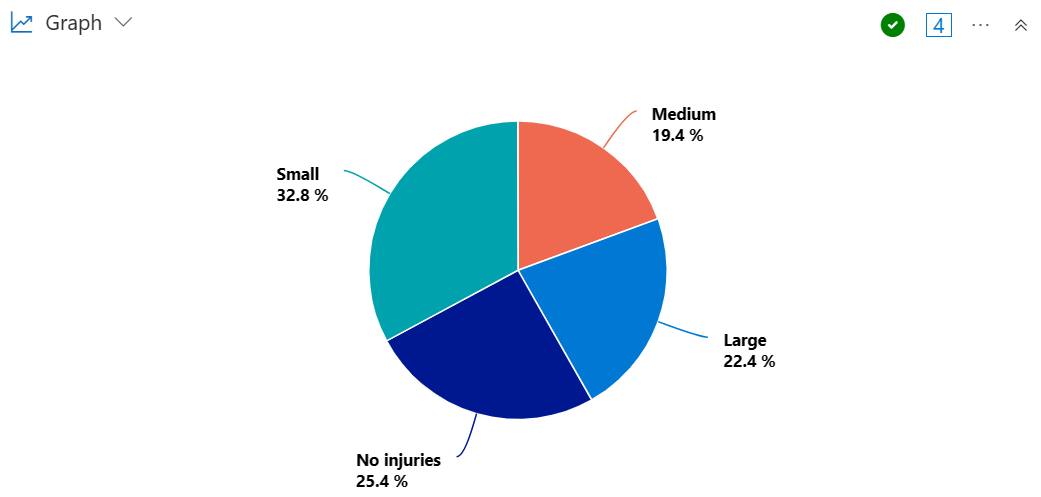
Injuries bucket pie chart
StormEvents
| summarize InjuriesCount = sum(InjuriesDirect) by State
| extend InjuriesBucket = case(
    InjuriesCount > 50, 'Large',
    InjuriesCount > 10, 'Medium',
    InjuriesCount > 0, 'Small',
    'No injuries')
| summarize InjuriesBucketCount = count() by InjuriesBucket
| render piechart
Perform aggregations over a sliding window
For the first 2 weeks of July 2007, calculate the minimum, maximum, and average property damage of tornados, floods, and wildfires using a sliding window of 7 days. Each record in the result set aggregates the preceding 7 days, and the results contain a record per day in the analysis period.
| TimeStamp | EventType | min_DamageProperty | max_DamageProperty | avg_DamageProperty |
|---|---|---|---|---|
| 2007-07-08T00:00:00Z | Tornado | 0 | 30,000 | 6,905 |
| 2007-07-08T00:00:00Z | Flood | 0 | 200,000 | 9,261 |
| 2007-07-08T00:00:00Z | Wildfire | 0 | 200,000 | 14,033 |
| 2007-07-09T00:00:00Z | Tornado | 0 | 100,000 | 14,783 |
| 2007-07-09T00:00:00Z | Flood | 0 | 200,000 | 12,529 |
| 2007-07-09T00:00:00Z | Wildfire | 0 | 200,000 | 14,033 |
| … | … | … | … | … |
let windowStart = datetime(2007-07-01);
let windowEnd = windowStart + 13d;
StormEvents
| where EventType in ('Tornado', 'Flood', 'Wildfire')
// Bin each record to a single day relative to windowStart, e.g., 2007-01-02 * -> 2007-01-02
| extend bin = bin_at(startofday(StartTime), 1d, windowStart)
// Add 7d to set the end of the range for each record; clamp values outside [windowStart, windowEnd]
| extend endRange = iff(bin + 7d > windowEnd, windowEnd,
                        iff(bin + 6d < windowStart, windowStart,
                            iff(bin + 6d < bin, bin, bin + 6d)))
// Create an array of 7 days for each record, starting from the current day of the record
| extend range = range(bin, endRange, 1d)
// Expand the array to duplicate each record to 7 records with one-day intervals between them
| mv-expand range to typeof(datetime)
// Perform the aggregations for each day. Due to the prior expansion, this summarizes the previous 7 days
| summarize
    min(DamageProperty), max(DamageProperty), round(avg(DamageProperty))
    by TimeStamp = bin_at(range, 1d, windowStart), EventType
| where TimeStamp >= windowStart + 7d;
Still need to revisit this query. A lot going on.
References
- help.Samples | Azure Data Explorer. dataexplorer.azure.com . Accessed May 24, 2025.
- Tutorial: Use aggregation functions in Kusto Query Language - Kusto | Microsoft Learn. learn.microsoft.com . Aug 12, 2024. Accessed May 24, 2025.
contains the database referenced in this document.