Measuring Productivity
Devs' Diverging Perceptions of Productivity
Got interested in measuring it two years into my SWE career.
Initially rated myself based on % of completed daily objectives. The objectives didn’t necessarily correspond to work items. Stopped because the numbers were high even on days when I didn’t feel productive.
Switched to “stuff that affects others” (later came to know these are “function points”). More intuitively captures non-code objectives, e.g., aligning folks on feature specs. Numbers seem low; never a double digit month. Open question on how to incorporate code reviews into my daily rating.
Burn-down chart is underwhelming. Maybe the items are too broad? Or am I not as productive as I presume?
Majority of the scholarship is on top-down perspectives that measure artifact output per unit of time, e.g., LoC modification per hour, resolution time for modification requests, function points created per month, etc. However, this misses developers' individual work roles, practices, work fragmentation, tooling, office environment, etc. For example, a dev who spends a lot of time supporting co-workers might develop less code, and appear less productive. In contrast, a bottom-up approach better understands individual work habits, how they relate to productivity perceptions, and which factors are most important for a dev’s productivity.
Devs context switch on average 13 times an hour. They may still feel productive, because the cost of context switching varies. Writing a quick email while waiting for a build to complete does not harm productivity, while discussing an unrelated topic with a co-worker is a costly context switch.
What is unproductive work?
- Fighting with CI over linting that can’t be semi-automated.
- Meetings w/o a scoped agenda.
- Incidental costs, e.g., flaky tests, merge conflicts.
- Wrangling with tools, e.g., long compilation times.
On an average 8.4h workday, devs spend on average 4.3h on their computer, with \(\approx\) 2.1h on coding-related activities. Majority consider coding as the most productive activity. Meetings were the most controversial; opposers cited lack of goals/outcomes, and too many attendees. No single activity was unanimously considered exclusively productive or unproductive, e.g., coding is not productive when the dev is blocked on a task.
Asked to quantify their productivity, most want number of completed tasks to be augmented by other measures, e.g., LoC, # bugs found/fixed, emails sent, etc. No single measure or combination of measures were consistently rated higher by most. The measures depend on the context, e.g., using the number of tasks completed is accurate for a dev that spends most of their time coding, as opposed to meetings or helping co-workers.
How can trends be gleaned? Consecutive days may have different contexts, e.g. Monday is meeting-heavy, and Tuesday is coding-heavy. If rating each day to a percentage, how is 100% determined?
From hourly self-reports of productivity ratings, three clusters that are similar to the circadian rhythm emerge: morning people (20%), low-at-lunch people, and afternoon-people (%40). Asked to rate what is productive vs. unproductive, six clusters emerged:
- Social developers love collaborating and doing code reviews.
- Lone developers avoid interruptions like noise, email, meetings, and code reviews, preferring quiet.
- Focused developers feel productive while working efficiently, and unproductive when stuck or interrupted.
- Balanced developers are less affected by distractions, but feel unproductive when tasks are unclear or unfamiliar, or causing overhead.
- Leading developers prefer meetings, emails, writing specs, and feel less productive with coding activities.
- Goal-oriented developers feel productive when they cross off (or make progress on) tasks.
These clusters can be used to tailor process improvements to the different types of developers.
So far, I’m interested in what I, as an non-manager, can do to boost the team’s productivity in a mostly C++ environment. So far, most of this feels actionable only from a managerial position.
Factors that Are Causally Linked with Perceived Productivity
draws stronger causal inferences (with fewer confounding factors) about productivity drivers in ecologically valid settings (as opposed to non-representative dev environments) than prior works.
To draw stronger causal inferences, use panel data analysis instead of the more typical cross-sectional data analysis. The data came from tooling logs (e.g. code review tool), and the company-wide Engineering Satisfaction survey.
The dependent variable, productivity, was coded from the dev’s answer to the “Overall, in the past 3 months, how productive have you felt at Google/Alphabet?” question in the EngSat survey. Subjective measures of productivity are easy to collect, have more literature, and have been shown to be correlated with objective measures like the median active coding time.
For the independent variables, both subjective and objective measures were used, e.g. satisfaction with project code quality, project tech debt, innovativeness of tools and infrastructure, 50th and 90th percentile of rounds of code review, total time spent in meetings, etc.
In panel data analysis, the delta in each individual’s responses and metrics are tracked. This should eliminate time invariant effects, e.g. prior education, that must explicitly accounted for in longitudinal studies lest they be confounding factors. That said, time variant effects, e.g. Alice getting a mentor who impacts her productivity, cannot be ruled out by the analysis.
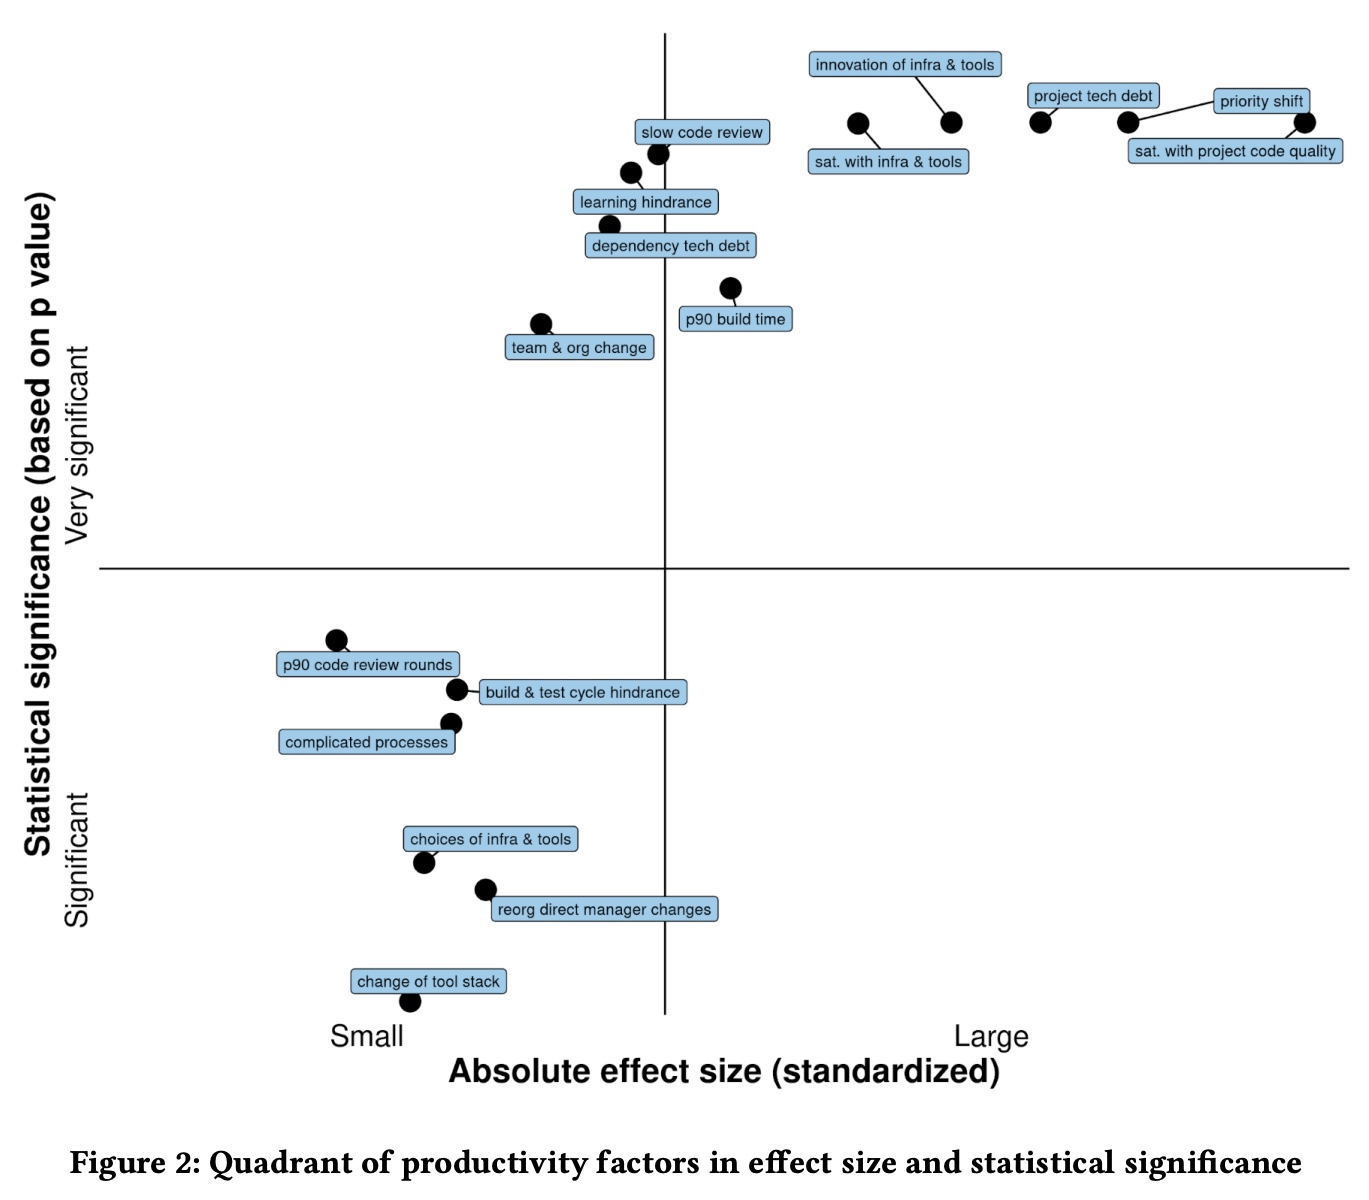
Lower perceived productivity is causally related to satisfaction with project (but not dependencies) code quality, perceived technical debt, non-innovative tools/infra, too many/few choices of tools/infra, pace of change in dev tool stack that is too fast/slow, having to learn new tooling/infra/framework, longer build times, longer build & test cycle, multiple rounds of reviews per code review, slow code review, shifting project priorities, more changes of direct managers, hindrance by team and organizational reasons, and complicated team processes.
Conventional panel data analysis can only establish the presence of a causal relation, but not the direction of the causality. do lagged panel analysis to tease out directionality for the relationship between code quality and productivity. A 100% increase of satisfaction with project code quality at time \(T-1\) was associated with a \(10\%\) decrease of median coding time per change-list (CL), a \(12\%\) decrease of median wall-clock time from creating to mailing a CL, and a \(22\%\) decrease of median wall-clock time from submitting to deploying a CL at time \(T\). On the other hand, changes in satisfaction with project code quality in time \(T\) were not associated with any of the productivity metrics in time \(T-1\). The data supports the hypothesis that changes in code quality during time \(T-1\) are correlated with changes in productivity at time \(T\).
Some notable factors that did not have a statistically significant relationship with perceived productivity: poor/missing documentation, actual time spent in meetings, physical distance from manager, physical distance from code reviewers, and organizational distance from code reviewers.
Best Practices
Self-Monitoring
My current system:
- Set objectives for the week.
- Set daily agenda. Track estimation times vs. actual time, and explain discrepancies.
- At the end of the day, evaluate myself using function points .
- Also note any code reviews done on that day.
Areas that can be improved:
- How do I make the data on time estimated vs. time taken actionable?
- How granular/strict should my tracking get? Sometimes I skip setting agenda so that I can move fast.
Sample tools in the space: RescueTime tracks time spent in different applications; Codealike visualizes time spent inside the IDE in different code projects. But little is known about devs' expectations and experiences with self-monitoring in the workplace.
Following a literature review, 400-dev survey, and 5 pilot studies with 20 devs, built (and later open-sourced) PersonalAnalytics. It collects data in the background about application use, documents assessed, sites visited, code reviews, emails, etc. Every hour, it prompts the dev to rate their productivity. Captured data is visualized in the app.
Personalization and customization increased satisfaction and long-term engagement. Devs wanted to personalize which measures were tracked and visualized. They requested for more data, e.g. comparison with teammates, correlating with biometric data such as stress level, sleep, and exercise, etc.
The popup asking to self-report productivity for the past hour increases awareness about efficiency, and prompts a change tactics if need be. They valued that they’re the ones who rate their productivity, as an automated measure wouldn’t accurately capture.
The retrospection increases self-awareness and provided novel insights, e.g., time actually spent with emails, misconceptions that they’re more productive in the morning, etc.
Actionability was ambivalent. Half were able to update behavior, e.g. taking advantage of more productive afternoons. Others requested that the tool provide recommendations based on the data collected. Even better, being able to set a goal and then monitor their progress towards reaching it.
Focusing only on individual insights may miss team opportunities, e.g., scheduling meetings when everyone is least productive, and sometimes harm team productivity, e.g., dev blocking out interruptions at inopportune times. To account for privacy, the tool only stored the logs locally on the user’s machine. While some devs voluntarily shared their visualizations and insights with teammates to compare themselves, some said they’d start to game the tool, or even leave the company if their manager forced them to run a tracking tool that would ignore their privacy concerns.
mention sharing anonymized or aggregated data with the rest of the team as a future improvement to the tool. Isn’t this something that differential privacy could solve?
References
- Rethinking Productivity in Software Engineering. Chapter 22. Fitbit for Developers: Self-Monitoring at Work. André Meyer; Thomas Fritz; Thomas Zimmermann. University of Zurich; Microsoft. doi.org . 2019. ISBN: 978-1-4842-4221-6 .
- A Discipline for Software Engineering. Watts Humphrey. 1995. ISBN: 978-0201546101 .
- Rethinking Productivity in Software Engineering. Chapter 12. Developers' Diverging Perceptions of Productivity. André Meyer; Gail Murphy; Thomas Fritz; Thomas Zimmermann. University of Zurich; University of British Columbia; Microsoft. doi.org . 2019. ISBN: 978-1-4842-4221-6 .
- What Improves Developer Productivity at Google? Code Quality. Lan Cheng; Emerson Murphy-Hill; Mark Canning; Ciera Jaspan; Collin Green; Andrea Knight; Nan Zhang; Elizabeth Kammer. ACM Joint European Software Engineering Conference and Symposium on the Foundations of Software Engineering, 30th. Google. doi.org . 2022.
It would actually feel unproductive to not switch contexts when waiting on a build to complete.